
The Skinny
If a starfish is cut into two, it becomes two starfish since it has a decentralized nervous system and each part regenerates into a full starfish. Whereas when a creature with a brain/centralized nervous system is cut into two, it dies - because all the decision making is centralized.

Harnessing the power of an organization’s data comes down to one key decision - when to use a decentralized structure and when to use a centralized structure. But data platform companies are too focused on centralized structures and AI companies are too focused on decentralized structures. Even system integrators are usually good in one area or another, and tend to push that area aggressively.
This is the number one reason why organizations end up spending years and millions of $ and not really reaping the benefits of harnessing their data.
We will use this unique Starfish and Brain approach to deliver quick, measurable and significant improvements to SHK’s different businesses.
Here are the main highlights of data analysis using both techniques.
| Starfish | Brain | |
|---|---|---|
| Structure | Centralized | Decentralized |
| Use Cases |
|
|
| Data Science | Machine Learning | Deep Learning |
| Training Data | Structured data that is cleaned, tagged and indexed | Unstructured data passed through layers of neural networks |
Big Data simplified

All of the chatter and sales pitches around big data can be simplified into four basic processes.
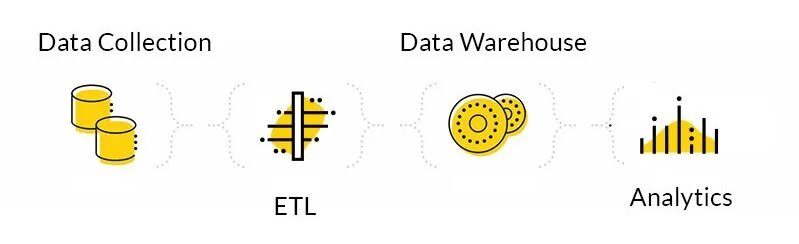

Data Collection
Data is collected from different in-house and cloud data sources such as CRM, accounting data, customer support database, supply chain system etc.
ETL
ETL stands for Extract, Transform, Load. Data from multiple databases is extracted, then transformed and loaded into one central data warehouse.
This step also makes sure that all the data operations are performed on staging data and not on live data.


Data Warehouses
Structured data is aggregated from the different data streams and prepared for analytics and insights.
Analytics and Reporting
The data is fed to business insights, analytics, visualization and reporting tools to extract useful insights.

No need to reinvent the wheel

The Process
The process does not require building any custom platforms. We can use commercially available, cloud based tools for each of the four steps explained above.
Case definition
First, we need to define a set of problem statements to focus all the data efforts and achieve significant and measurable results.
A couple of such cases are illustrated in the following section. Some of these cases can span across multiple/all SHK businesses, while some others might pertain to specific SHK businesses such as SmarTone.

Problem Statement
Once the cases are defined, and the data platforms are put in place, the analytics process will involve three main steps.
Feature Engineering

Feature Engineering involves a bunch of activities performed on the raw data to consolidate, cleanup and create an environment to run analytics.
Data Modeling

We model the data to generate mathematical and statistical graphs. These are analyzed to generate insights and forecast future results.
Model Evaluation

This stage involves understanding how the data curves interact in the graphs to generate Starfish results which are hard to predict at the outset.
Case 1
Customer journey mapping

Smart tagging and indexing
Brain approach
Tags that span across different SHK businesses are created. Then the customer data across the different CRM systems is indexed in a smart way to make sales and servicing customers more efficient.
Identifying customers in similar life stages across businesses
Grouping customers with similar purchasing power across businesses
Marking customers in the different CRM systems who are are good cross-sell potentials
Creating more efficient KPIs for sales and customer service staff based on analyzing successful practices across the different businesses

Events that matter
Starfish approach
An event based system is setup so that events are triggered whenever there is a change in any customer’s data patterns across the different SHK business systems. Statistical models are used to analyze the events to decide which events really matter and based on this, actions that can help sales or support are programmed to execute.
For instance, when a user of SHK parking who regularly parks at a certain location, changes his daily parking location, that event is surfaced up in the SmarTone and SHK real estate sales CRM systems as that user may have changed his work place or home and might have had a significant life event like a new job or new home etc.


Connect the CRMs
Different SHK businesses maybe using different customer management databases. Building pipelines across the multiple CRMs will enable better sales and customer management using the approaches mentioned above.
Increase LTV and reduce CAC
We can build workflows for new and existing customers using the approaches above to increase the life time value of customers and reduce the customer acquisition costs of new customers.

Case 2
Bringing the best out of the SHK sales teams

Sales calls are a science
We can analyze both offline and online sales activities to create a pattern of what works, what doesn’t and how to improve it.

Clone the closers
We can capture the best practices of your best sales closers across different SHK businesses to coach the entire sales team.
Sample client data projects

Some examples of recent projects where we have helped some leading organizations to use their data to make big leaps of progress.
| Brain approach | Starfish approach | |
|---|---|---|
| American Red Cross | Volunteer assignment system Whenever there is a big disaster American Red Cross relies on a large database of volunteers helping in disaster relief services. We built a system to use the data to predict which volunteers are likely to help when there's a disaster, based on the type of disaster, the proximity of the volunteer to the disaster, whether the volenteer has already helped in the past months, etc. The system helped increase the deployment of volunteers by American Red Cross by over 25% |
Call center automation Red Cross’s interactive voice response (IVR) system was transferring far too many calls to human agents, at tremendous cost to the company and its customer satisfaction scores. Rule engine based approaches hadn't fixed this. We built a sentiment analysis driven system that was able to reduce calls transferred to human agents by 15% and improve customer satisfaction scores by 30% |
| PwC |
Tax recommendation system for expats We cross linked data across mobility, logistics and payroll databases to predict how much an expat's taxes would be in different geographies. PwC was able to use this to bridge the gap between HR and finance departments in their clients. |
Consulting sales We built a system that enabled PwC to identify companies that aren't clients of its audit business and predict which of them would be good potential clients for its consulting business. PwC was able to use this to land several new consulting clients. |
| One of Europe's top 5 airlines | Abandoned cart conversion system We built an AI system that analyzes abandoned carts and predicts what is the next flight that lead might buy, to what destination and at what price point. The system is being used to increase abandoned cart conversions in four European countries. |
Influencer driven travel We are building a system that is able to look at advertising analytics data and predict which indluencers can inspire people to travel on routes that are profitable to the airline. |
| O2 (Telefonica) | O2 stores sales We analyze data to increase the sales per O2 store by identifying financial and credit services that can be sold to consumers in an O2 store. |
Micro Credit Services We are building a system that can provide O2 users micro credit services based on analyzing events from O2's customer management database. |
Summary

