REVOLUTIONARY DESIGN
Design is not just what it looks and feels like.
Design is how it works.
We bring a unique perspective and an obsessive attention to detail to product design.
Customers expect nothing less than great products -- regardless of technology, platform, or context. Businesses need to ensure they can create and sustain products that deliver on larger strategic objectives.
frog designs and engineers for the real world to ensure our clients' products create an emotional connection from first use and deliver on their strategic intent.
Our offerings support the blurring between digital and physical products. To create experiences that scale frog provides brand design as well as design systems services. Our history, footprint and experience spans sectors, from consumer goods to highly-regulated industries.
GREAT DESIGN IS
UNFORGETTABLE
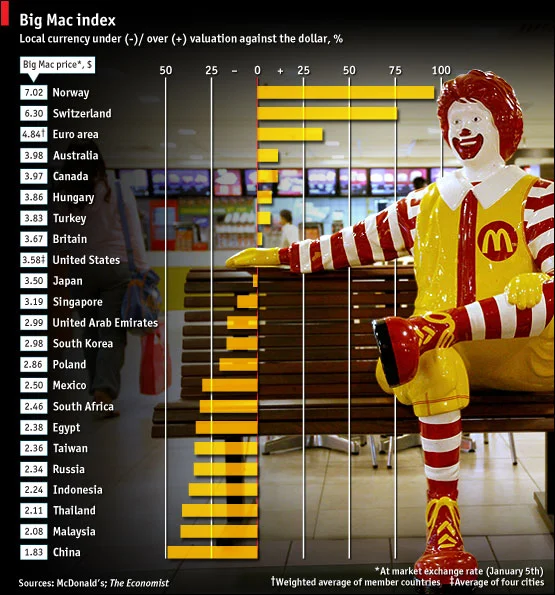
The Big Mac Index is a brilliantly designed index that shows whether currencies are at their “correct” level. For example, the average price of a Big Mac in America in July 2016 was $5.04; in China it was only $2.79 at market exchange rates. So the "raw" Big Mac index says that the yuan was undervalued by 45% at that time.
We don't design graphs. We make data unforgettable.
The Big Mac Index makes data as dull as tracking currencies fun and impacting by using a remarkable metaphor.
COLLABORATIVE
The Big Mac Index is a brilliantly designed index that shows whether currencies are at their “correct” level. For example, the average price of a Big Mac in America in July 2016 was $5.04; in China it was only $2.79 at market exchange rates. So the "raw" Big Mac index says that the yuan was undervalued by 45% at that time.
We don't design graphs. We make data unforgettable.
The Big Mac Index makes data as dull as tracking currencies fun and impacting by using a remarkable metaphor.

MEASURABLE

The Big Mac Index is a brilliantly designed index that shows whether currencies are at their “correct” level. For example, the average price of a Big Mac in America in July 2016 was $5.04; in China it was only $2.79 at market exchange rates. So the "raw" Big Mac index says that the yuan was undervalued by 45% at that time.
We don't design graphs. We make data unforgettable.
The Big Mac Index makes data as dull as tracking currencies fun and impacting by using a remarkable metaphor.
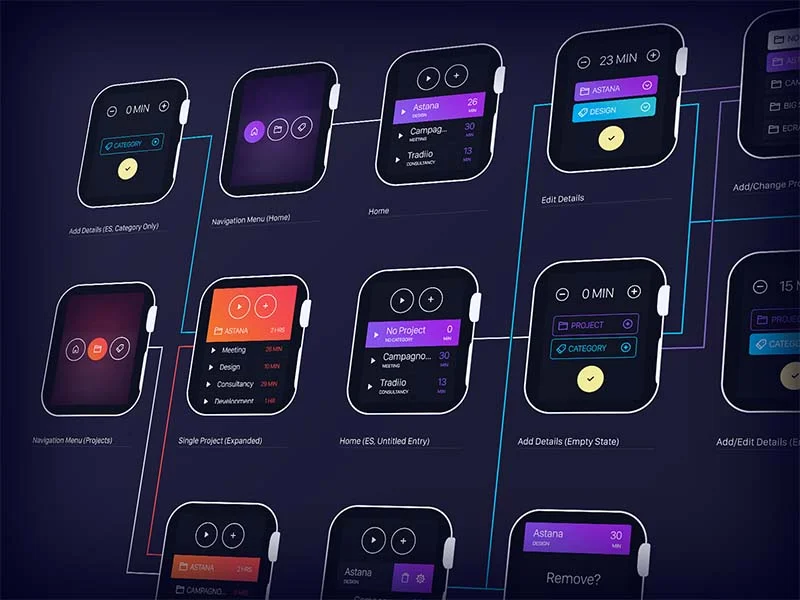
PIXEL PERFECT
The Big Mac Index is a brilliantly designed index that shows whether currencies are at their “correct” level. For example, the average price of a Big Mac in America in July 2016 was $5.04; in China it was only $2.79 at market exchange rates. So the "raw" Big Mac index says that the yuan was undervalued by 45% at that time.
We don't design graphs. We make data unforgettable.
The Big Mac Index makes data as dull as tracking currencies fun and impacting by using a remarkable metaphor.
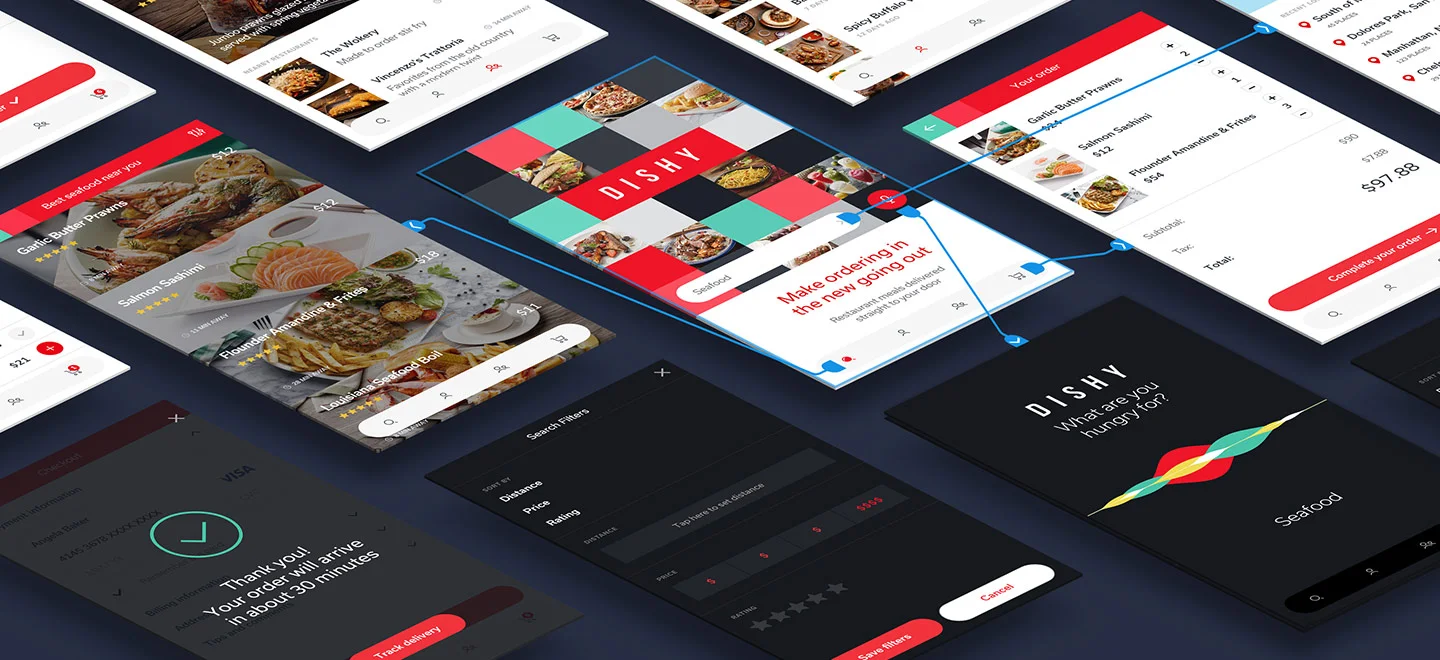
A LOT OF DATA IN A SMALL SCREEN
The Big Mac Index is a brilliantly designed index that shows whether currencies are at their “correct” level. For example, the average price of a Big Mac in America in July 2016 was $5.04; in China it was only $2.79 at market exchange rates. So the "raw" Big Mac index says that the yuan was undervalued by 45% at that time.
We don't design graphs. We make data unforgettable.
The Big Mac Index makes data as dull as tracking currencies fun and impacting by using a remarkable metaphor.
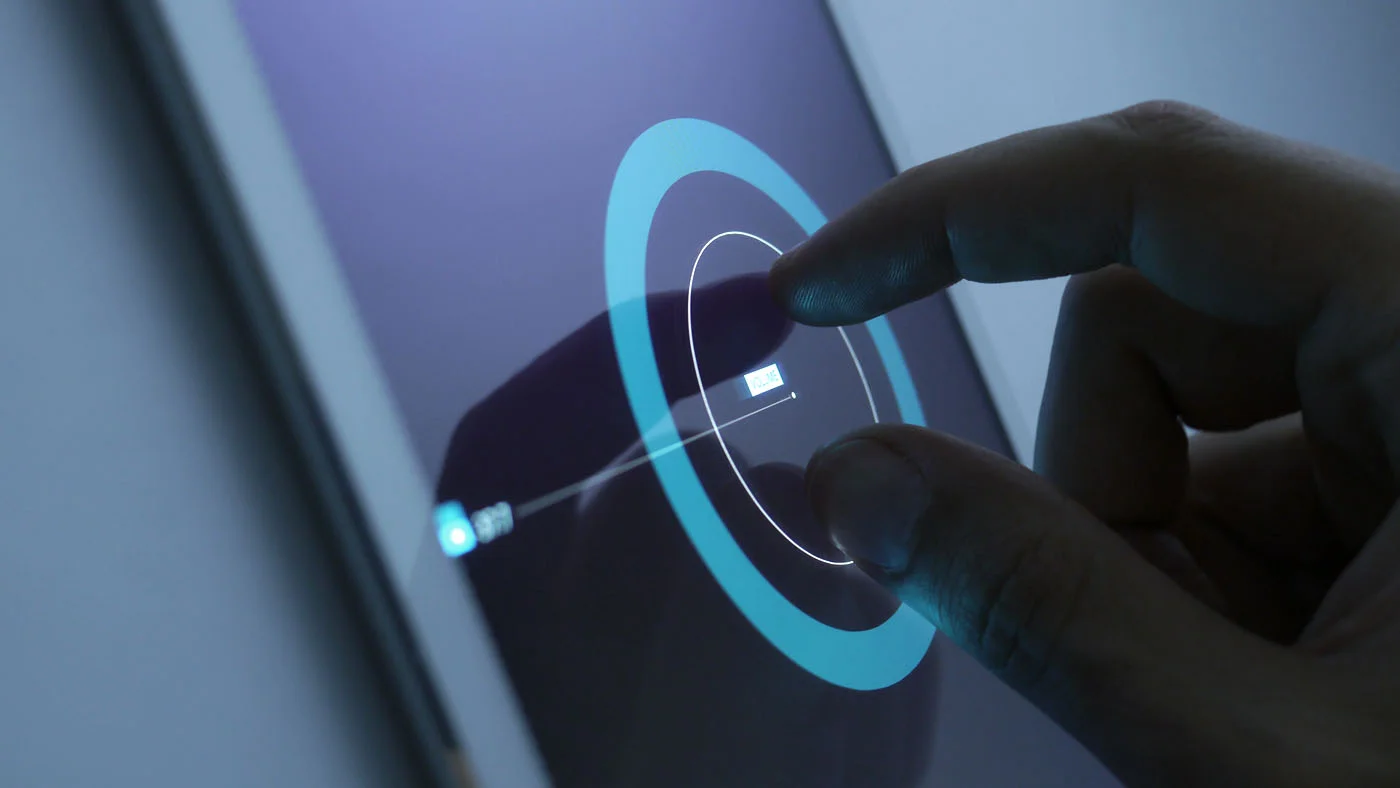
A MINIMAL INTERFACE IN A LARGE SCREEN
The Big Mac Index is a brilliantly designed index that shows whether currencies are at their “correct” level. For example, the average price of a Big Mac in America in July 2016 was $5.04; in China it was only $2.79 at market exchange rates. So the "raw" Big Mac index says that the yuan was undervalued by 45% at that time.
We don't design graphs. We make data unforgettable.
The Big Mac Index makes data as dull as tracking currencies fun and impacting by using a remarkable metaphor.